Thursday, October 31, 2013
Happy Anniversary
Nov 1st, 2013. Today makes one year anniversary of me being back home in Myanmar. Many of my friends would know how much I was dying, a year ago, to be back home.
Within this one year, I got a chance to travel a lot to so many places in Myanmar via work, vacation, family visits, so on.
To be exact, I spent 59 days traveling around 22 towns; that is, 16% of a year. Ohhh and I haven't mentioned that I will be out of town for the next two weeks. That's not as much traveling compared to some of my friends or colleagues. But I am still traveling a lot in Burmese eyes, at least in my parents' eyes.
So being quite a nerd, I ended up making a map of my travel locations to celebrate/ commemorate this anniversary.
Myanmar is such a small country and yet I still have a lot to explore. Most of my travel locations have been repeatedly visited. Hopefully, next year, I will have gathered bigger sample size to make prettier map. =)
Monday, October 28, 2013
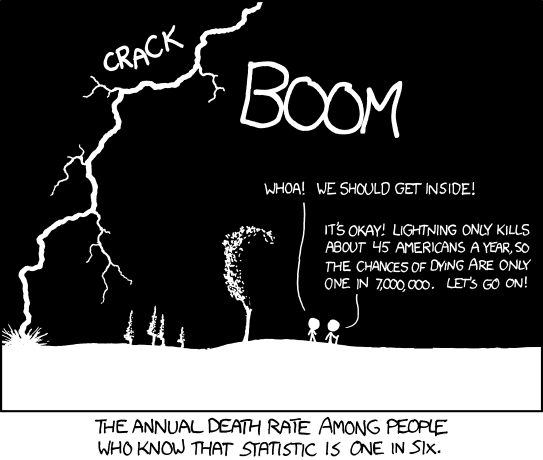
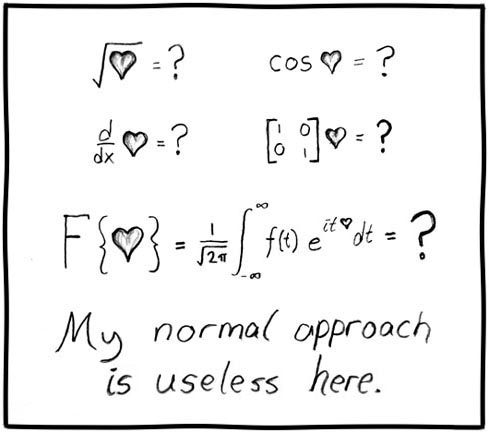
xkcd
Saturday, October 26, 2013
Spotting an outlier
နံပါတ္တစ္ခု မွားေနမွန္း ကၽြန္မဘယ္လိုသိသလဲလို႕ မၾကာခဏ အေမးခံရပါတယ္။ အမွန္အတိုင္းေျပာရရင္ နံပါတ္တစ္ခု မွားေနမွန္း ကၽြန္မအျမဲတမ္း တန္းျပီး မသိႏိုင္ပါဘူး။ အခ်ိဳ႕နံပါတ္ေတြကေတာ့ ဆိုင္ရာ ဘာသာရပ္အေပၚ မူတည္ျပီး သိႏိုင္ပါတယ္။
ကၽြန္မဆီမွာ ကိုယ္ဝန္ေဆာင္သည္ေတြရဲ႕ ေသြးေပါင္ခ်ိန္ႏႈန္းေတြမွတ္ထားတဲ့ ေဒတာ ရွိတယ္ဆိုပါေတာ့။ အဲဒီေသြးေပါင္ခ်ိန္ႏႈန္းေတြမွာ အေပၚေသြး ၄၀ ေအာက္ရွိေနတာေတြ ေတြ႕တာနဲ႕ ဒီနံပါတ္မွားေနတယ္ဆိုတာ ကၽြန္မတန္းျပီး ေျပာႏိုင္ပါတယ္။ ေဒတာျဖည့္တဲ့သူမွားေနလား၊ ေသြးတိုင္းတဲ့သူပဲ မွားေနလား၊ တစ္ေယာက္ေယာက္ေတာ့ အမွားလုပ္ခဲ့တာမွန္း တန္းသိပါတယ္။အဲဒါဘာလို႕လဲဆိုေတာ့ ကၽြန္မမွာ ဇီဝေဗဒအေျခခံရွိတဲ့အတြက္ လူတစ္ေယာက္က ေသြးေပါင္ခ်ိန္ အဲဒီေလာက္နည္းေနလို႕ရွိရင္ အသက္ေတာင္မရွင္ႏိုင္ေတာ့ဘူးဆိုတာ သိေနလို႕ပါ။
ဒါေပမယ့္ Statistician ေတာ္ေတာ္မ်ားမ်ားက ဆိုင္ရာဘာသာရပ္ေတြမွာ ကၽြမ္းက်င္သူေတြ မဟုတ္ၾကဘူးေလ။ ဒီေတာ့ ကိုယ္နဲ႕ အကၽြမ္းတဝင္မရွိတဲ့ ဘာသာရပ္က ေဒတာကို ၾကည့္ရျပီဆိုရင္ေတာ့ အမွားကို လံုးဝမေျပာႏိုင္ေတာင္မွ မွားႏိုင္ေခ်ရွိတဲ့နံပါတ္ေတြကို ရွာလို႕ရပါတယ္။ အဲဒါကို outlier လို႕ေခၚပါတယ္။ ဒီ outlier ေတြကို ရွာခ်င္ရင္ နည္း ၂ နည္း ရွိပါတယ္။ သူတို႕ကေတာ့ သေဘာတရားက အတူတူပါပဲ။ ၂ နည္းစလံုးမွာ ေဒတာရဲ႕ ျဖန္႕က်က္မႈ (Distribution) ကို အေျခခံထားတာပါ။
ပထမနည္းကေတာ့ ကိုယ့္ေဒတာရဲ႕ အနည္းဆံုးနံပါတ္ (Minimum Value) ၊ အမ်ားဆံုးနံပါတ္ (Maximum Value) နဲ႕ ပ်မ္းမွ်ေခ် နံပါတ္ (Average Value) ေတြကို ယွဥ္ၾကည့္လိုက္ဖို႕ပါပဲ။ outlier ရွိႏိုင္တဲ့ ေဒတာမွာ အနည္းဆံုး ၊ အမ်ားဆံုး နဲ႕ ပ်မ္းမွ်ေခ် ေတြဟာ အရမ္းကို ကြာျခားေနႏိုင္ပါတယ္။ ပ်မ္းမွ်ေတြ အမ်ားၾကီးရွိႏိုင္ေၾကာင္း ကၽြန္မအရင္က ဒီပို႕စ္မွာ ေရးခဲ့ပါေသးတယ္။
အေပၚက Histogram မွာဆိုရင္ ရွိဖို႕ေတာ္ေတာ္ရွားတဲ့ အရပ္ ၇ ေပနဲ႕ ၁ လက္မ ရွိေနတဲ့ ေက်ာင္းသားေတြကို တန္းျပီးျမင္ရပါတယ္။
Friday, October 25, 2013
Finite Simple Group (of Order Two)
ကၽြန္မ ေကာလိပ္ေနာက္ဆံုးႏွစ္ ယူျဖစ္ခဲ့တဲ့ သခ်ၤာအတန္းတစ္ခုက Modern Algebra မွာေပါ့။ ပါေမာကၡက အတန္းထဲမွာ ဒီသီခ်င္းေလးကို youtube ေပၚကေန ဖြင့္ျပခဲ့တယ္။ ဒီသီခ်င္းကို ေရးတဲ့သူနဲ႕ ဆိုတဲ့သူေတြက Klein Four Group လို႕ေခၚတယ္။ သူတို႕က ဒီလိုသီခ်င္းေတြ ေရးတုန္း ဆိုတုန္းကေတာ့ သခ်ၤာ ဘြဲ႔လြန္ ေက်ာင္းသားေတြ၊ အခုေတာ့ အသက္ေတြၾကီးျပီး ပါေမာကၡေတြေတာင္ ျဖစ္ကုန္ျပီ။
ဒီသီခ်င္းက Modern Algebra ကို အေျခခံျပီး ေရးထားတဲ့ အခ်စ္သီခ်င္းေလးတစ္ပုဒ္ ျဖစ္ပါတယ္။ ကၽြန္မၾကားဖူးခဲ့သမွ် အခ်စ္သီခ်င္းေတြထဲမွာ အဓိပၸါယ္ အရွိဆံုးထဲမွာ ပါပါတယ္။ သီခ်င္းနာမည္က Finite Simple Group လို႕ ေခၚပါတယ္။ Modern Algebra သေဘာတရားအရ အဖြဲ႕ေလးေတြ အမ်ားၾကီးရွိႏိုင္တာေပါ့။ အဲဒီအထဲကမွ သုညရယ္ တစ္ ရယ္ပဲ ပါတဲ့ ႏွစ္ေယာက္တည္းကမာၻအဖြဲ႕ကေတာ့ အရွင္းဆံုးေပါ့။ သူ႕ကို Order (အဖြဲ႕ဝင္) ႏွစ္ခုပဲရွိတဲ့ Finite Simple Group လို႕ေခၚပါတယ္။ ဒီသီခ်င္းမွာေတာ့ တစ္က သုညအေပၚ သူ႕ရဲ႕အခ်စ္ေတြကို ရင္ဖြင့္ေျပာေနတာေပါ့။
တစ္က ဘယ္ဂဏန္းနဲ႕ပဲ သြားေျမွာက္ေျမွာက္ အဲဒီဂဏန္းပဲ ျပန္ထြက္တယ္ေလ။ အဲဒါေၾကာင့္မို႕ တစ္ကို သခ်ၤာမွာ Identity လို႕ေခၚတယ္။ ကိုယ္ပိုင္ဟန္လို႕ ဘာသာျပန္ရမလားပဲ။ ဒါေပမယ့္ တစ္က သုညနဲ႕ သြားေျမွာက္ရင္ေတာ့ ဂဏန္းတစ္ခုခုထြက္မယ့္အစား မရွိကိန္းျဖစ္တဲ့ သုညသြားထြက္တယ္။ အဲဒါကို Identity ေပ်ာက္တယ္လို႕ ဆိုလို႕ရပါတယ္။
ဒီေတာ့ ဒီ Finite Simple Group (of Order Two) မွာ သုညေၾကာင့္ တစ္က ဘယ္ေလာက္ပဲ သူရဲ႕ ပင္ကိုအက်င့္ေတြ၊ ဟန္ေတြ ေပ်ာက္သြားပါေစ၊ သူ႕ရဲ႕ အနာဂတ္က မရွိကိန္းတစ္ခု ျဖစ္ေနပါေစ၊ အျမဲ မခြဲဘဲ အတြဲ အတူေနသြားခ်င္ေၾကာင္း ေျပာေနတာပါ။
သီခ်င္းကို ဒီမွာ နားေထာင္ႏိုင္ပါတယ္။
http://www.youtube.com/watch?v=UTby_e4-Rhg&feature=channel_page
စာသားကေတာ့ ေအာက္မွာပါ။
The path of love is never smooth
But mine's continuous for you
You're the upper bound in the chains of my heart
You're my Axiom of Choice, you know it's true
But lately our relation's not so well-defined
And I just can't function without you
I'll prove my proposition and I'm sure you'll find
We're a finite simple group of order two
I'm losing my identity
I'm getting tensor every day
And without loss of generality
I will assume that you feel the same way
Since every time I see you, you just quotient out
The faithful image that I map into
But when we're one-to-one you'll see what I'm about
'Cause we're a finite simple group of order two
Our equivalence was stable,
A principal love bundle sitting deep inside
But then you drove a wedge between our two-forms
Now everything is so complexified
When we first met, we simply connected
My heart was open but too dense
Our system was already directed
To have a finite limit, in some sense
I'm living in the kernel of a rank-one map
From my domain, its image looks so blue,
'Cause all I see are zeroes, it's a cruel trap
But we're a finite simple group of order two
I'm not the smoothest operator in my class,
But we're a mirror pair, me and you,
So let's apply forgetful functors to the past
And be a finite simple group, a finite simple group,
Let's be a finite simple group of order two
(Oughter: "Why not three?")
I've proved my proposition now, as you can see,
So let's both be associative and free
And by corollary, this shows you and I to be
Purely inseparable. Q. E. D.
Thursday, October 24, 2013
Murphy eventually
Murphy's Law says "Anything that can go wrong will go wrong eventually". I am sure everyone has heard of it. Guess what! Murphy was right. Here is a simple statistical trick to prove it.
Step 1
Let's say,
Probability that A can go wrong = p
Probability that A cannot go wrong = 1 - p
Probability that A has never gone wrong after n trials = (1 - p)^n
Step 2
Probability that A will go wrong at least once after n trials
= 1 - Probability that A has never gone wrong after n trials
= 1 - (1 - p)^n
Step 3
Probability that A will go wrong eventually
= lim (n -> infinity) Probability that A will go wrong at least once after n trials
= lim (n -> infinity) 1 - (1 - p)^n
= 1 - lim (n -> infinity) (1 - p)^n
= 1
QED. Isn't it neat?
Wednesday, October 23, 2013
Histograms vs Column Graphs
ေက်ာင္းမွာ ငယ္ငယ္တုန္းက Histogram ဆိုျပီး ဂရပ္ဆြဲနည္းေလးေတြ သင္ခဲ့ရတယ္။ အခုၾကီးလာေတာ့ အလုပ္ခြင္မွာ Column/Bar Graphs ေလးေတြ ဘာေလးေတြ ဆြဲျပီး သံုးတတ္လာျပီ။ အဲဒီႏွစ္ခု ဘာကြာလဲလို႕ ေမးလို႕ရွိရင္ ေတာ္ေတာ္မ်ားမ်ားကေတာ့ အဲဒီႏွစ္ခု အတူတူ မဟုတ္ဘူးလားလို႕ ျပန္ေျပာလာပါလိမ့္မယ္။ ေတာ္ရံု Statistics ဒါမွမဟုတ္ သခ်ၤာ ဒါမွမဟုတ္ အင္ဂ်င္နီယာ ေက်ာင္းဆင္းေတြေတာင္ သိေလ့မရွိၾကပါဘူး။
Histogram ကေတာ့ ေဒတာေတြရဲ႕ ျဖန္႕က်က္မႈ (Distribution) ကို ျပတဲ့ ဂရပ္ျဖစ္ပါတယ္။ Column Graph ကေတာ့ အုပ္စုတစ္စုစီမွာ ကိုယ္တိုင္းတာခ်င္တဲ့ ကိန္းဂဏန္းက ဘယ္ေလာက္နည္းတယ္၊ မ်ားတယ္ ဆိုတာ ျပတဲ့ ဂရပ္ျဖစ္ပါတယ္။ သူတို႕ႏွစ္ခုရဲ႕ အဓိက ကြာျခားခ်က္က ဂရပ္ေအာက္နဲ႕ ေဘးက မ်ဥ္းေလးေတြ ျဖစ္ပါတယ္။ X ဝင္ရိုးနဲ႕ Y ဝင္ရိုးေတြေပါ့။
Histogram မွာ သူ႕ရဲ႕ေအာက္က X ဝင္ရိုးမ်ဥ္းက ကိန္းမ်ဥ္းျဖစ္ပါတယ္။ ကိန္းမ်ဥ္းျဖစ္တဲ့အတြက္ အျမဲတမ္း နံပါတ္ေတြနဲ႕ပဲ ျဖစ္ေနမယ္။ ေနာက္ျပီး ကိန္းမ်ဥ္းဆိုတာ တစ္ဆက္တည္းရွိတဲ့အတြက္ ဂရပ္က အတံုးေလးေတြကလည္း တစ္ခုနဲ႕တစ္ခု ကပ္ျပီးရွိေနမယ္။ အဲဒီအတြက္ ေဒတာက ဘယ္လိုျဖန္႕က်က္ေနလဲ၊ ေခါင္းေလာင္းပံုေလး (Normal Distribution) လား၊ တစ္သတ္မတ္တည္း (Uniform Distribution) လား၊ စတာေတြကို သိႏိုင္ပါတယ္။ ျပီးေတာ့ Histogram ရဲ႕ Y ဝင္ရိုးဟာ အျမဲတမ္း အေရအတြက္ နံပါတ္တစ္ခုျဖစ္ပါတယ္။
Column Graph မွာကေတာ့ သူ႕ရဲ႕ေအာက္ X ဝင္ရိုးမ်ဥ္းက အုပ္စုတစ္စုစီကို ကိုယ္စားျပဳတာျဖစ္ပါတယ္။ အဲဒီအုပ္စုက နံပါတ္ ျဖစ္ေကာင္းျဖစ္မယ္။ ဒါမွမဟုတ္ လူတစ္ေယာက္ခ်င္းစီ၊ က်ားမ စတဲ့ စာသားေတြလဲ ျဖစ္ႏိုင္တယ္။ နံပါတ္ပဲျဖစ္ျဖစ္၊ စာပဲျဖစ္ျဖစ္ သူ႕ရဲ႕မ်ဥ္းက ကိန္းမ်ဥ္းမဟုတ္ပါဘူး။ အဲဒါကေတာ့ Histogram နဲ႕ အဓိက ကြာျခားခ်က္ပဲ ျဖစ္ပါတယ္။ ျပီးေတာ့ Column Graph ရဲ႕ Y ဝင္ရိုးဟာ အျမဲတမ္း ညႊန္းကိန္းနံပါတ္ေလးတစ္ခု ျဖစ္ေနလိမ့္မယ္။ ဥပမာ - အရပ္အျမင့္၊ ကိုယ္အေလးခ်ိန္၊ ခရီးအကြာအေဝး၊ အသက္၊ တစ္ေန႕စားတဲ့ ကယ္လိုရီ စသည္ျဖင့္ အမ်ားစုမွာ ယူနစ္ေတြ ရွိေနလိမ့္မယ္။ Column Graph က ျဖန္႕က်က္မႈကို ေျပာတဲ့ ဂရပ္မဟုတ္ပါဘူး။
အေပၚက ပံုမွာ Histogram နဲ႕ Column Graph ကြာျခားခ်က္ကို ေက်ာင္းသား ၉ ေယာက္ရဲ႕ အရပ္တိုင္းထားတာနဲ႕ ဥပမာေပးထားပါတယ္။ ညာဘက္က Column Graph ဟာ ေက်ာင္းသားတစ္ဦးခ်င္းစီရဲ႕ အရပ္အျမင့္ကို ျပတဲ့ ဂရပ္ျဖစ္ျပီး ဘယ္ဘက္က Histogram မွာေတာ့ အရပ္အျမင့္တစ္ခုခ်င္းစီမွာ ေက်ာင္းသားဘယ္ႏွစ္ဦးရွိလဲဆိုတာကို ျပတဲ့ဂရပ္ျဖစ္ပါတယ္။ ဂရပ္ႏွစ္ခုစလံုးက ေဒတာတစ္ခုထဲက ယူထားတာ ျဖစ္ေပမယ့္ အဓိပၸါယ္ကေတာ့ မတူပါဘူး။
ကပ္သီးကပ္သပ္ ေျပာရမယ္ဆိုရင္ေတာ့ Histogram က Column Graph တစ္မ်ိဳးလို႕လဲ ေျပာလို႕ရပါတယ္။ ဒါကေတာ့ စာဖတ္သူ သေဘာပါ။
Subscribe to:
Posts (Atom)


